Company:
The Intercept Brasil is an award-winning news agency that holds the powerful accountable through combative journalism. Its in-depth investigations cover politics, corruption, the environment, public security, technology, media, and more.
Goal:
I was hired as an external information designer to transform extensive data collections into digital narratives that are both accessible and educational. My role was to design clear, engaging visual stories that help readers understand complex information.
Tools:
Adobe Creative Suite, Infogram, Excel
Process
1. Understanding the Data
I began by diving deep into the extensive data collected for several special reports. One of the main challenges was that the data was updated in real-time, so we needed a solution that allowed journalists to update it easily as new information became available.
2. Designing the Dynamic Narrative
To address this challenge, I created visualizations using Infogram, which integrates seamlessly with Google Sheets. This setup enabled journalists to update the data automatically, ensuring that our interactive visualizations remained current. My design focused on:
+ Interactive Visualizations: Crafting dynamic graphics that allow users to explore data.
+ Clear Information Hierarchy: Ensuring that every element guides the reader through the story.
+ Educational Content: Making sure complex data was presented in an easily digestible format.
+ Clear Information Hierarchy: Ensuring that every element guides the reader through the story.
+ Educational Content: Making sure complex data was presented in an easily digestible format.
3. Collaboration & Iteration
I worked closely with the editorial team to ensure that the designs complemented the investigative content and provided the necessary context. This collaborative process ensured that the final product was both accurate and compelling.
Examples of My Work
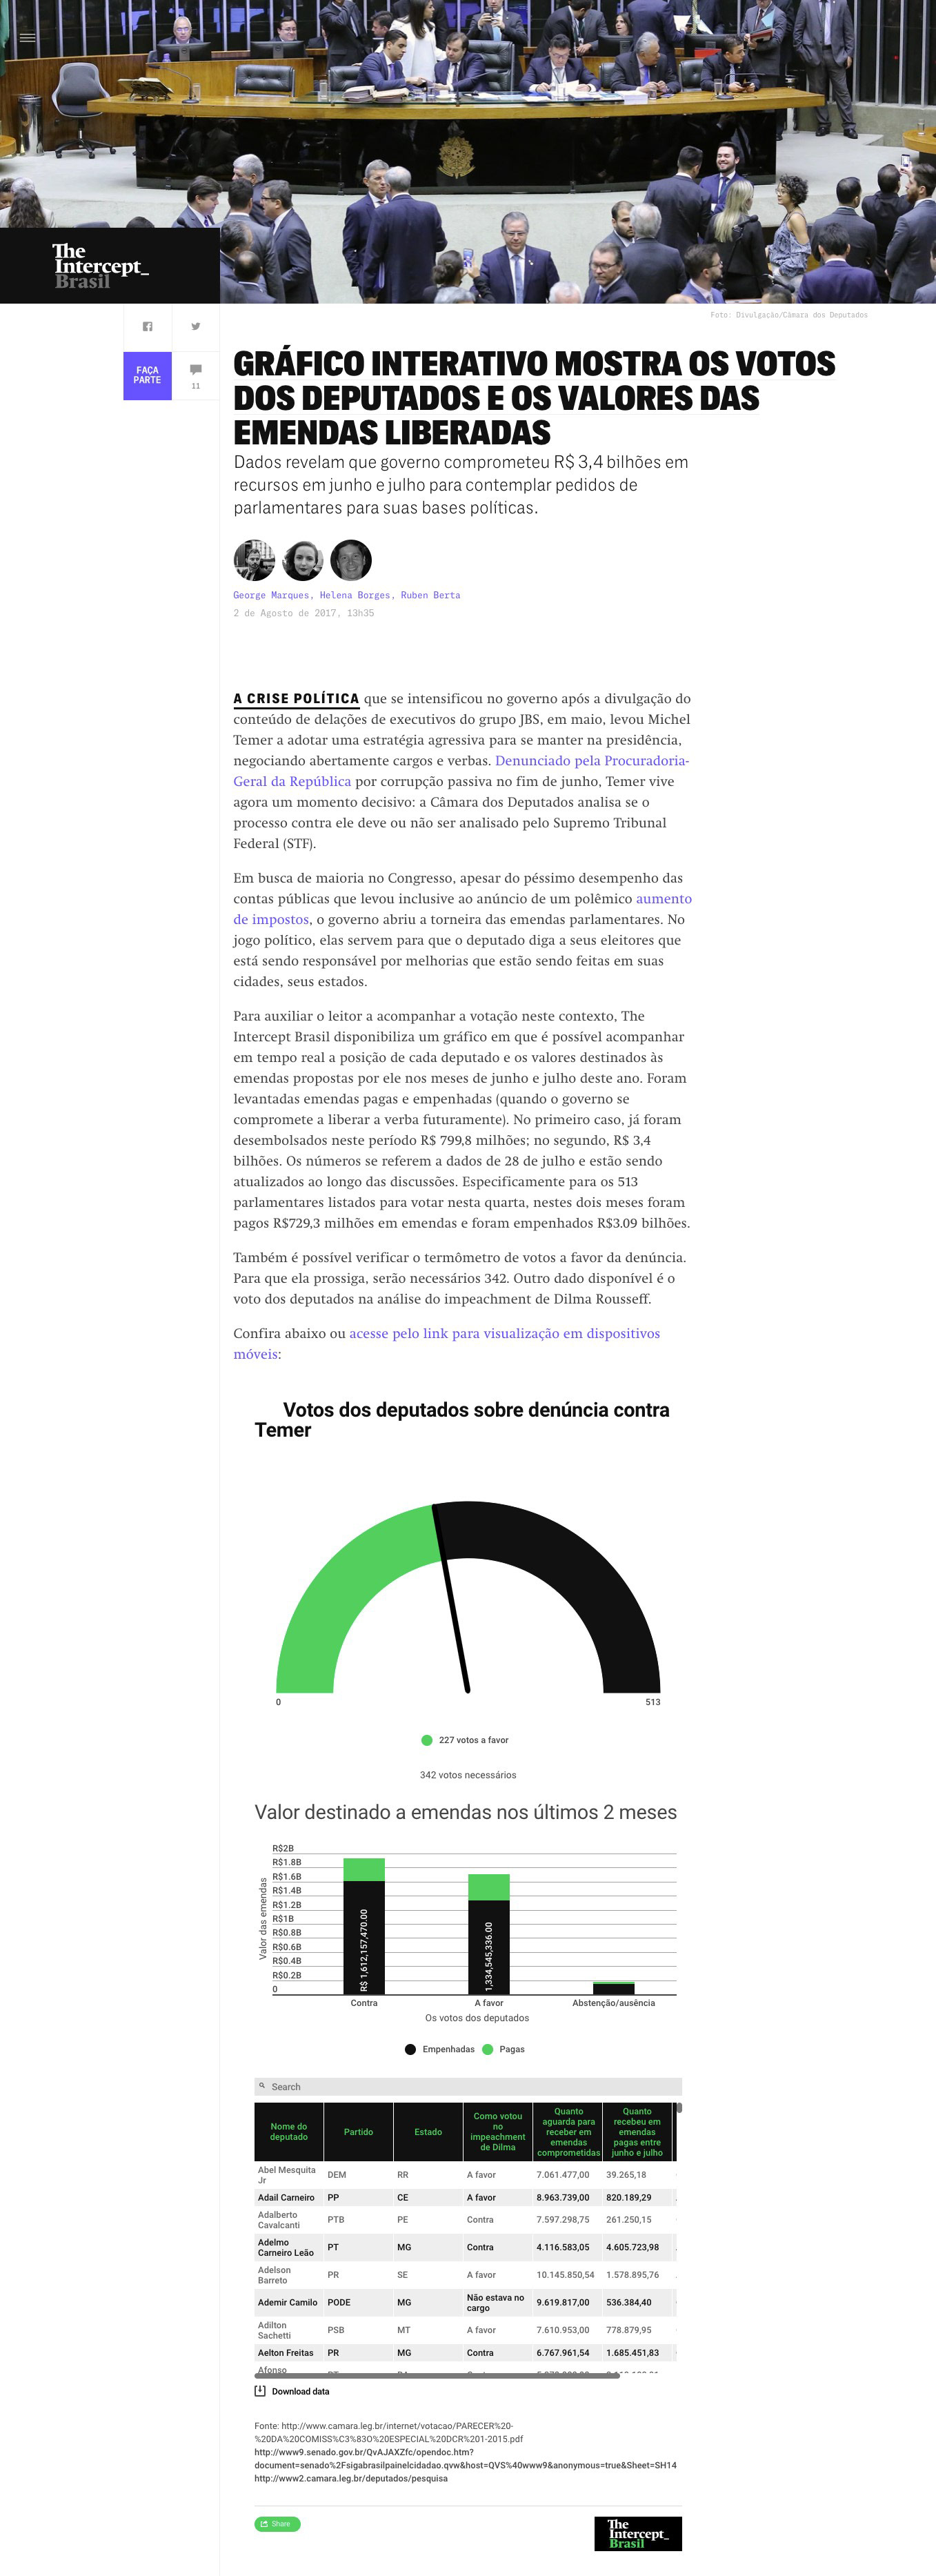
Interactive Graph:
An interactive graph displaying real-time voting by deputies alongside released monetary values.
[Access here]
An interactive graph displaying real-time voting by deputies alongside released monetary values.
[Access here]


Bribe Timer:
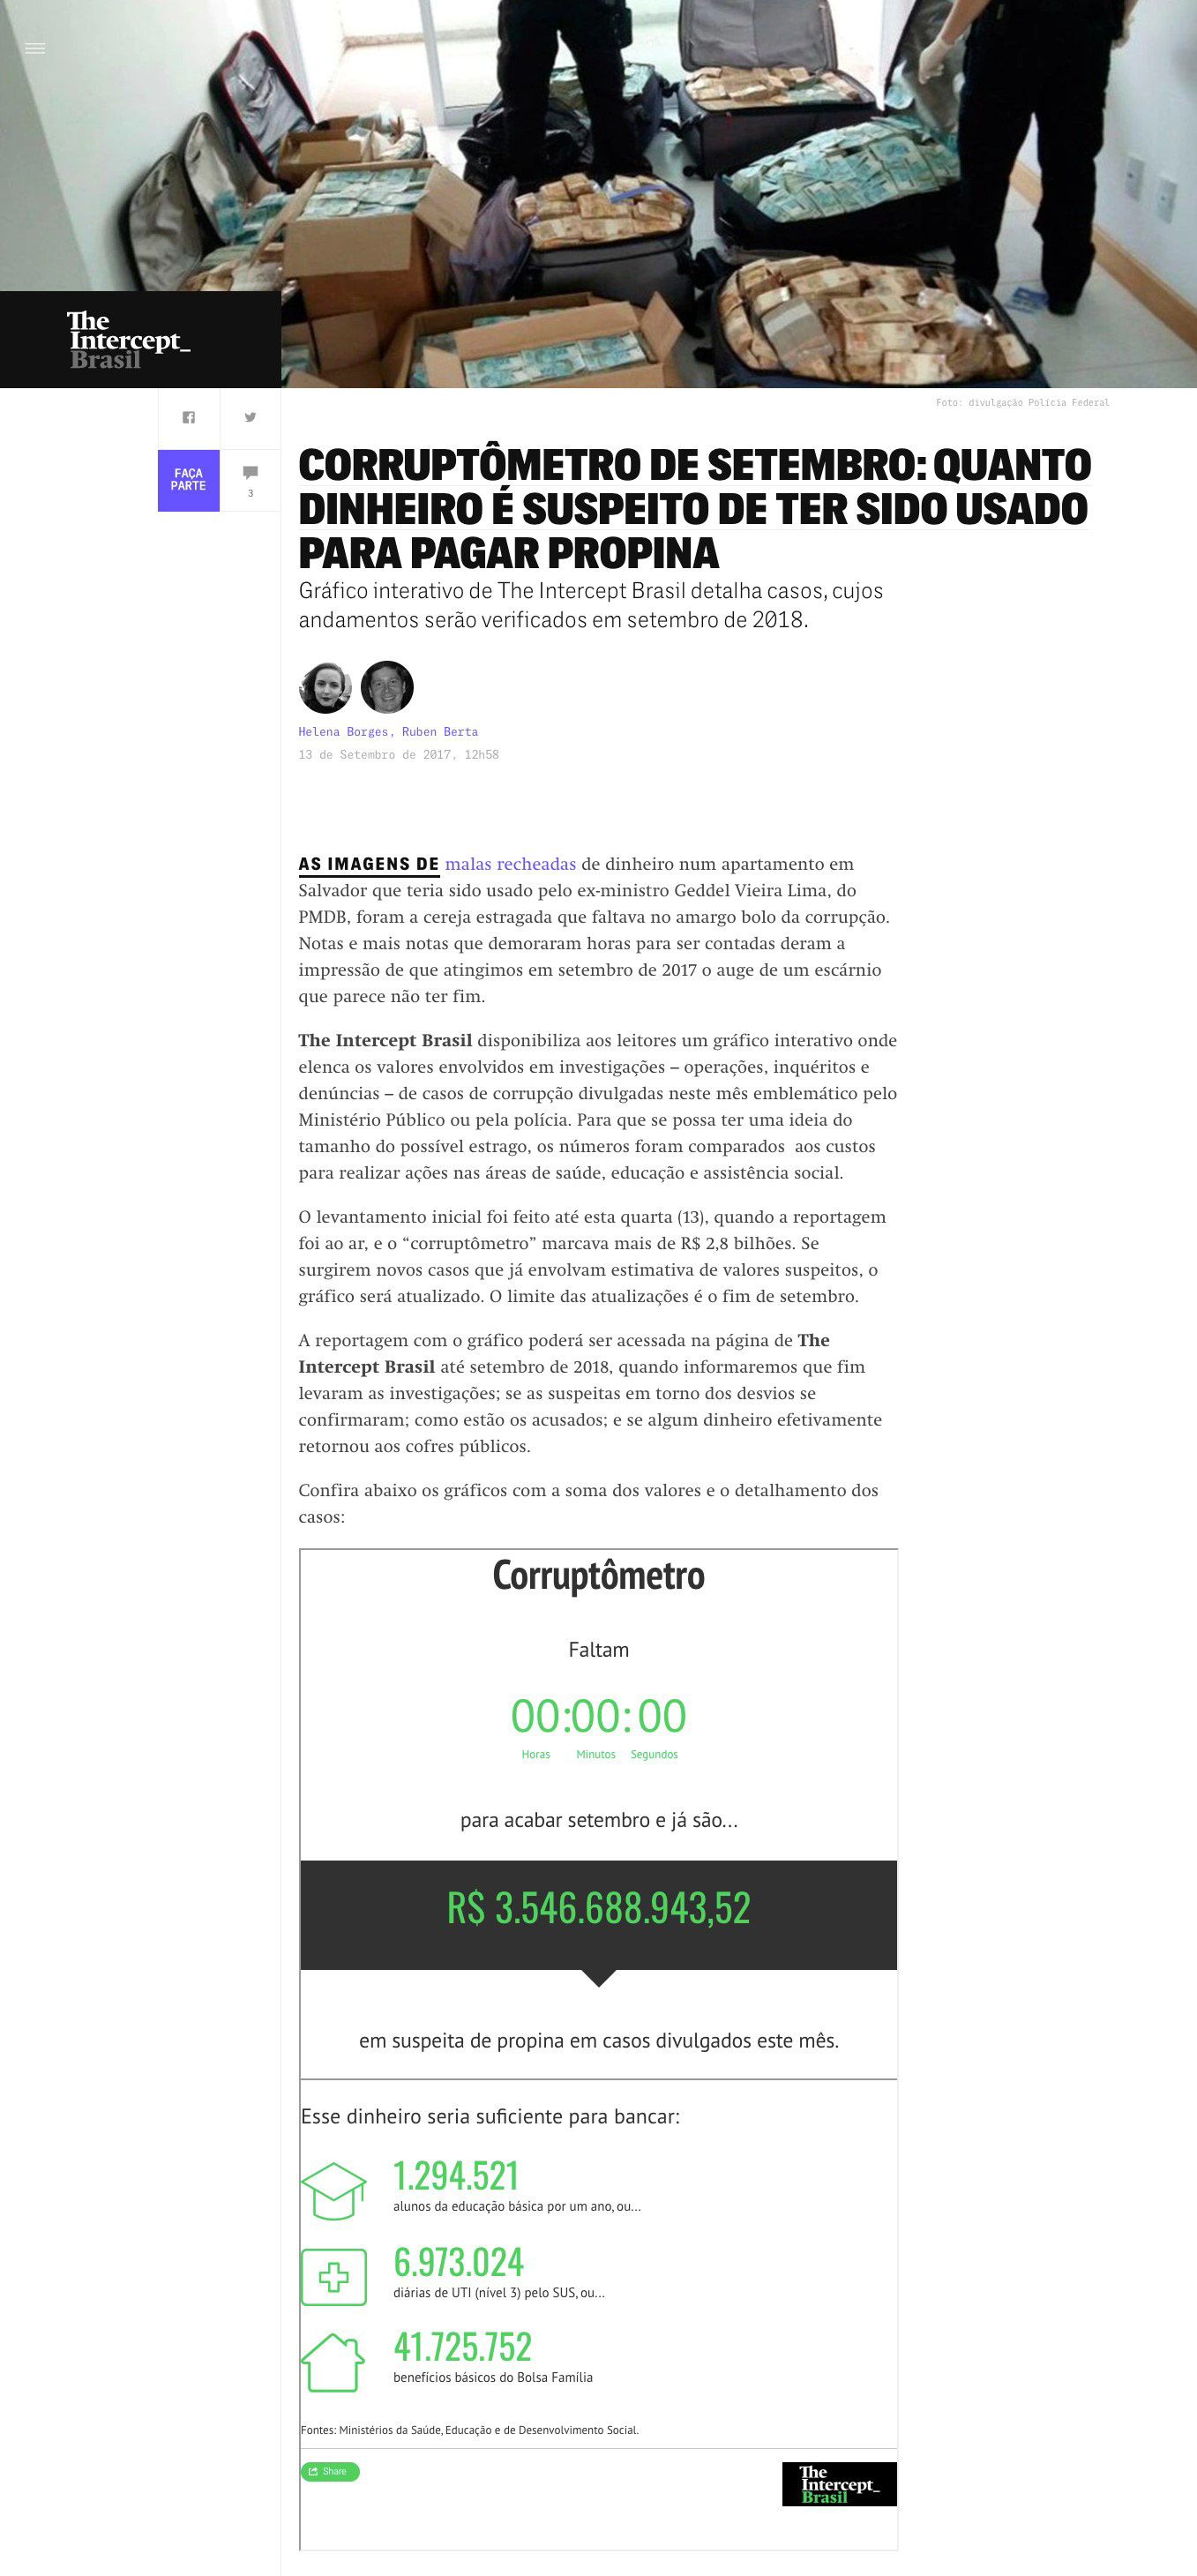
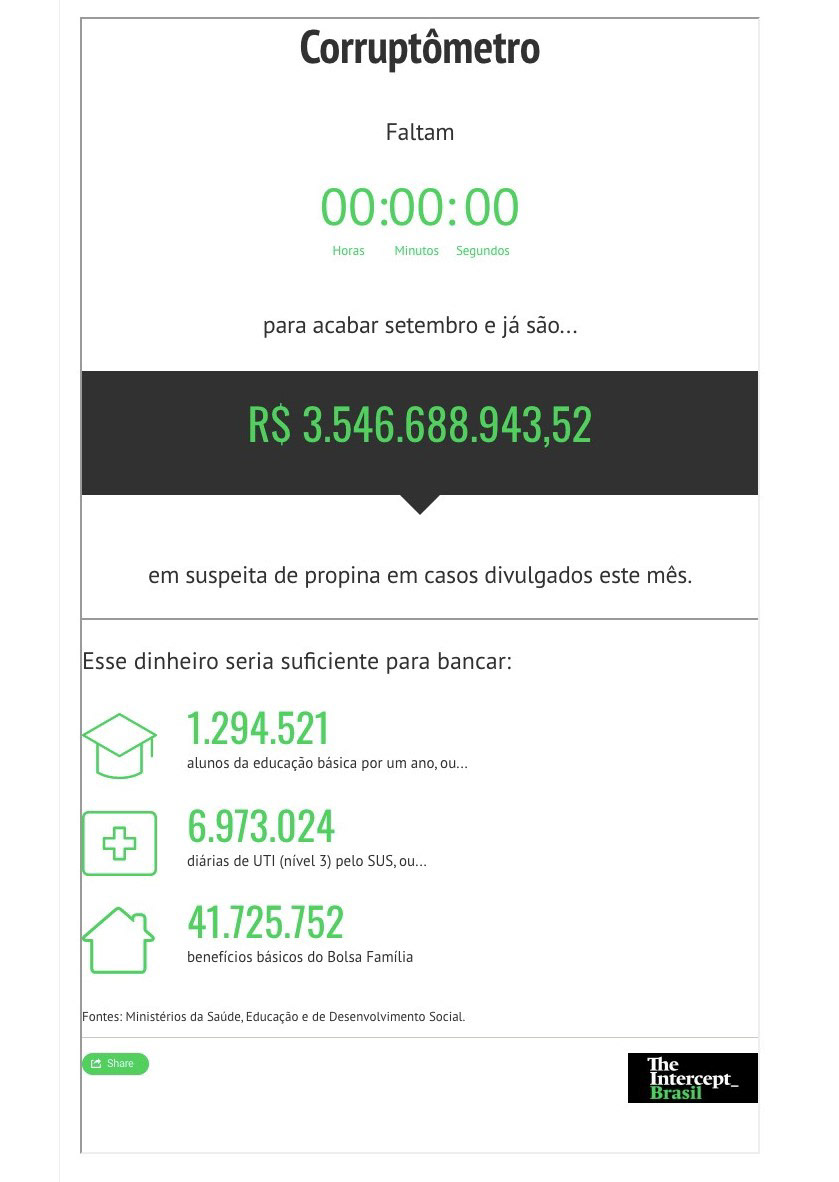
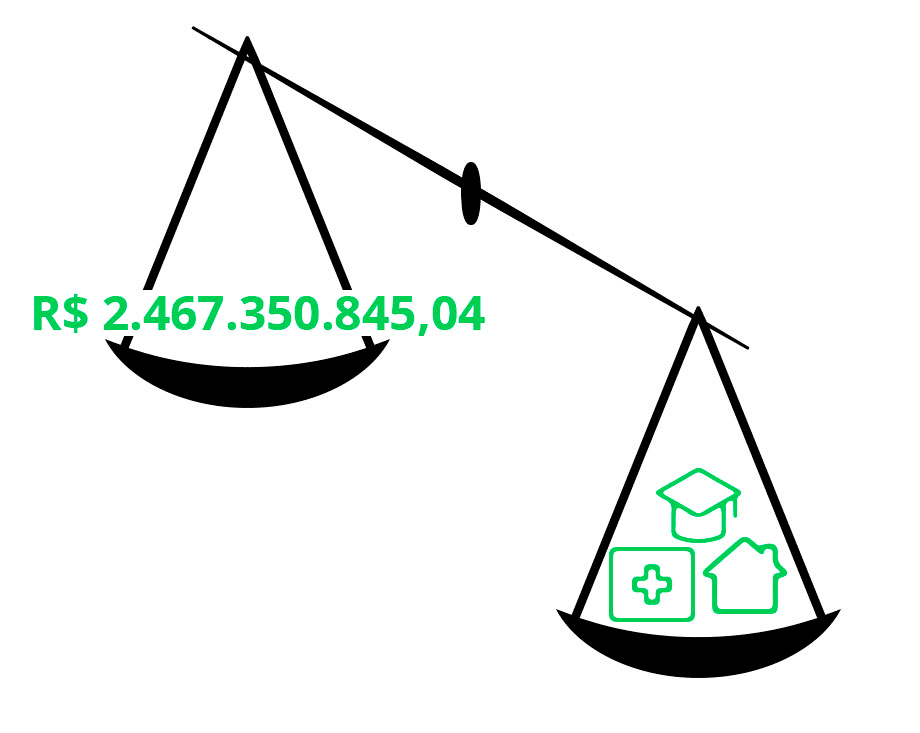
A dynamic timer showing the suspected amount of bribes paid in a given month.
[Access here]
A dynamic timer showing the suspected amount of bribes paid in a given month.
[Access here]

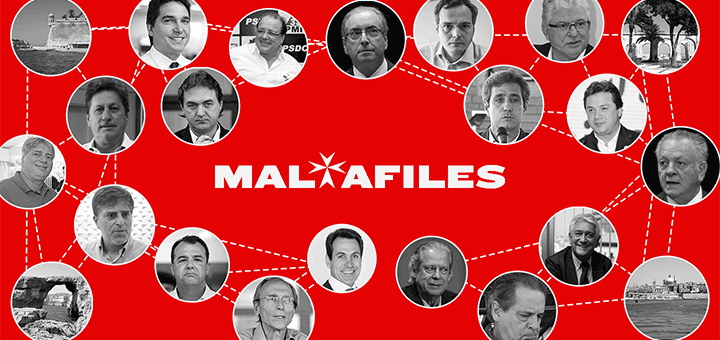
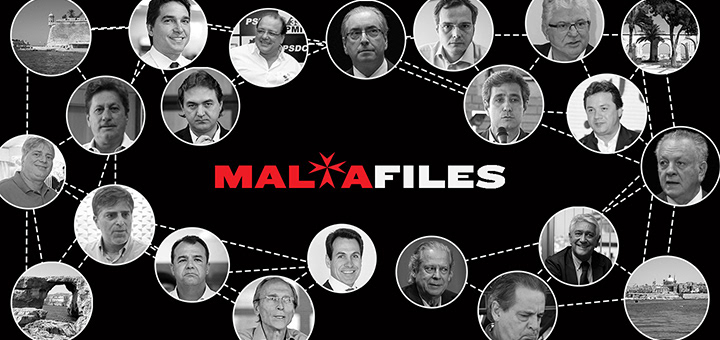
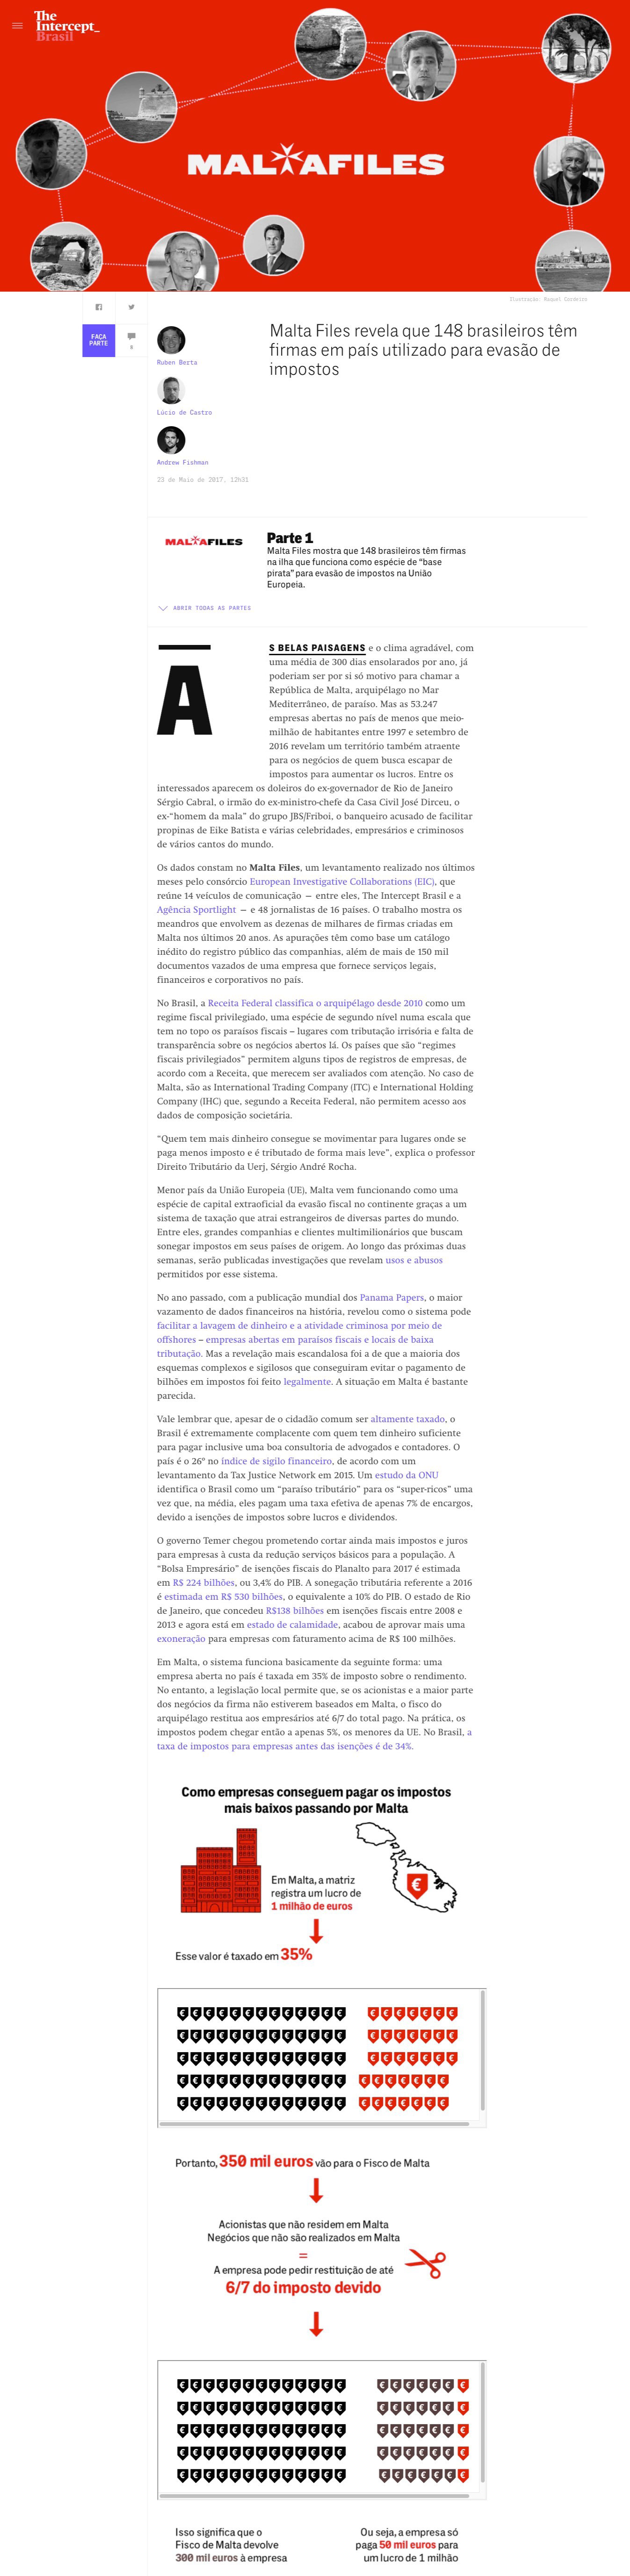
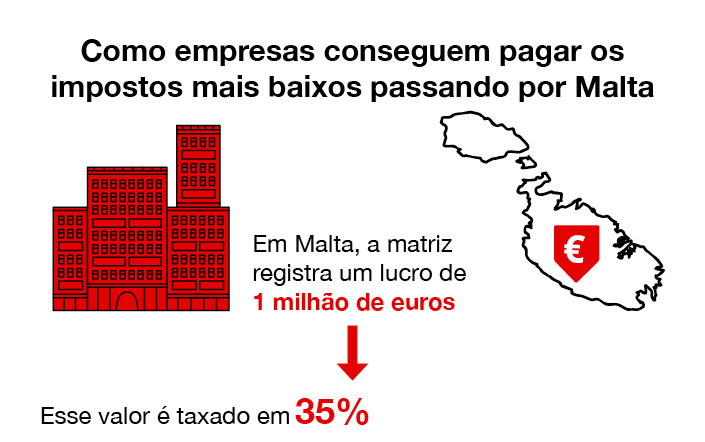
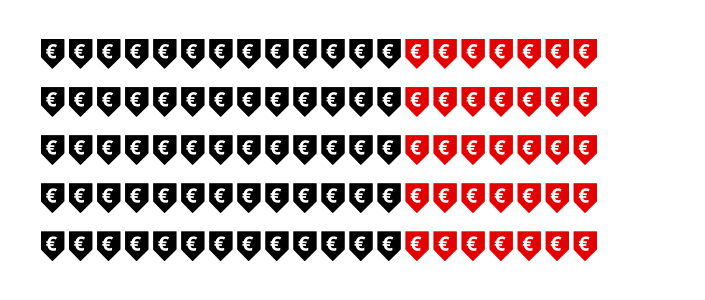
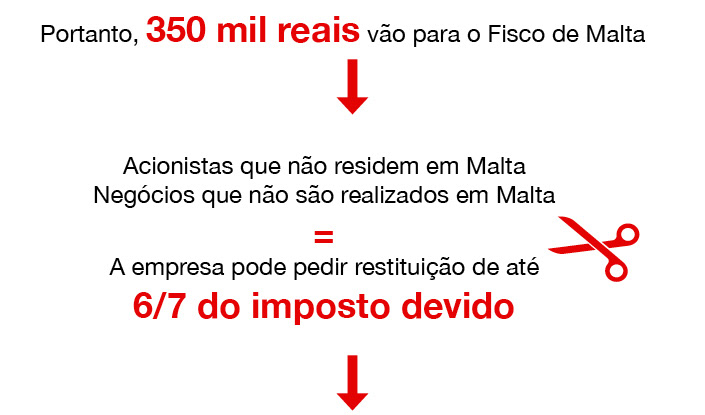
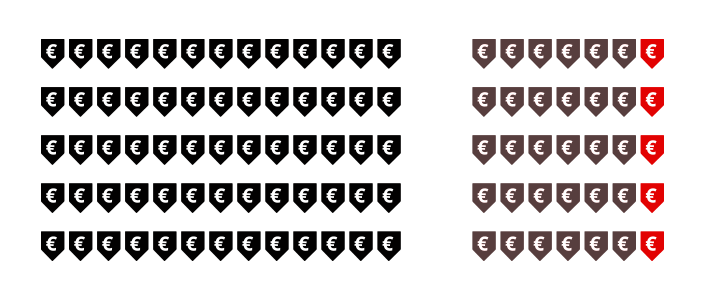
Leaked Documents Series:
A special series of reports featuring leaked documents from Malta’s tax haven, presented through engaging digital storytelling. We also developed additional content to extend the story's reach. For instance, we created an Instagram carousel that breaks down the report, explaining who the key characters are and providing further context to the investigation.
[Access here]


Series of headers created for various reports, each focusing on different characters featured in the exposé.


This project allowed me to blend design, data, and storytelling to create digital experiences that inform and captivate. If you’re interested in exploring how data can be transformed into engaging narratives, let’s connect!