Problem
The increasing availability of digital data often leads to an excessive focus on technology, overlooking integration with citizen participation. The design discipline emerges as a mediator, capable of bridging this gap by facilitating the translation and accessibility of complex data.
Goal
Testing a co-design process using data visualization to analyze mobility behavior in smart cities.
Methodologies
Literature review, case studies, Work Domain Analysis (WDA), Interview, System Usability Scale (SUS), Usability test, Diary study, Sentiment analysis from social media and Co-design workshop.
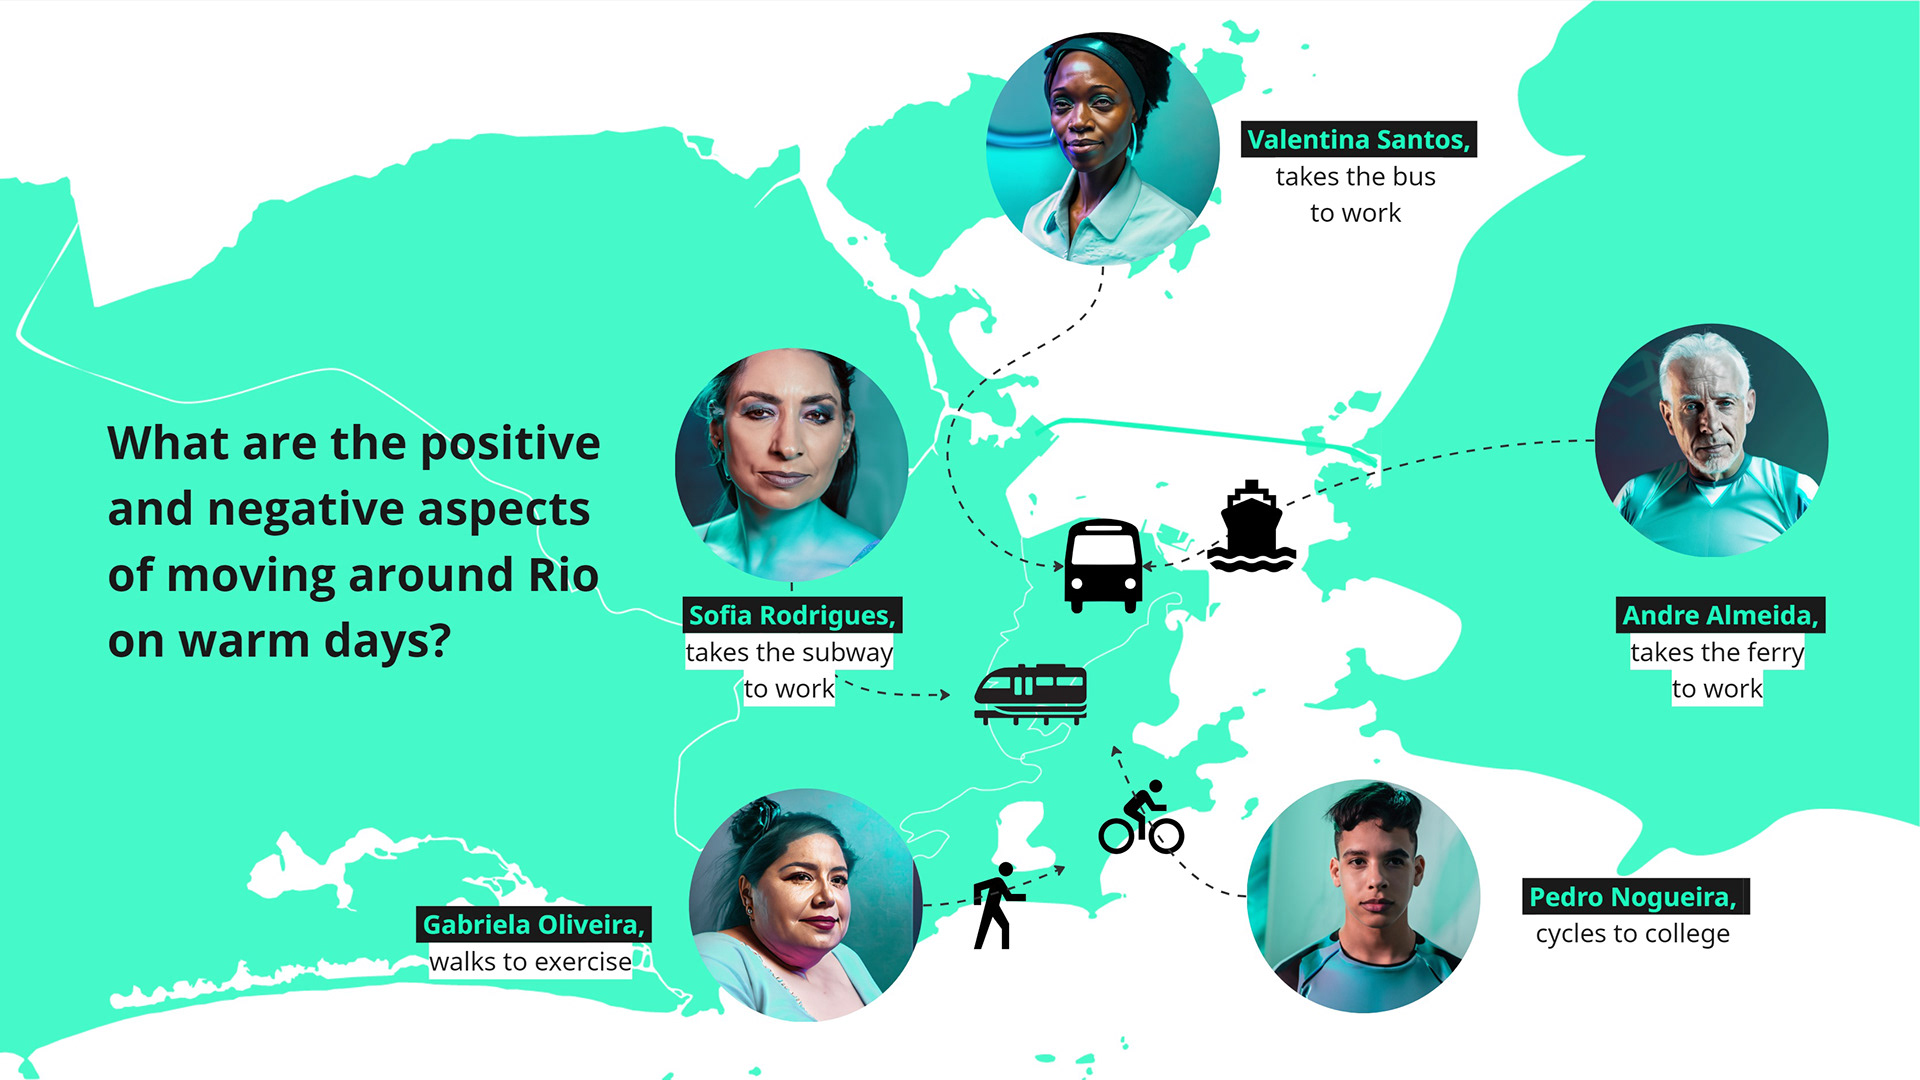
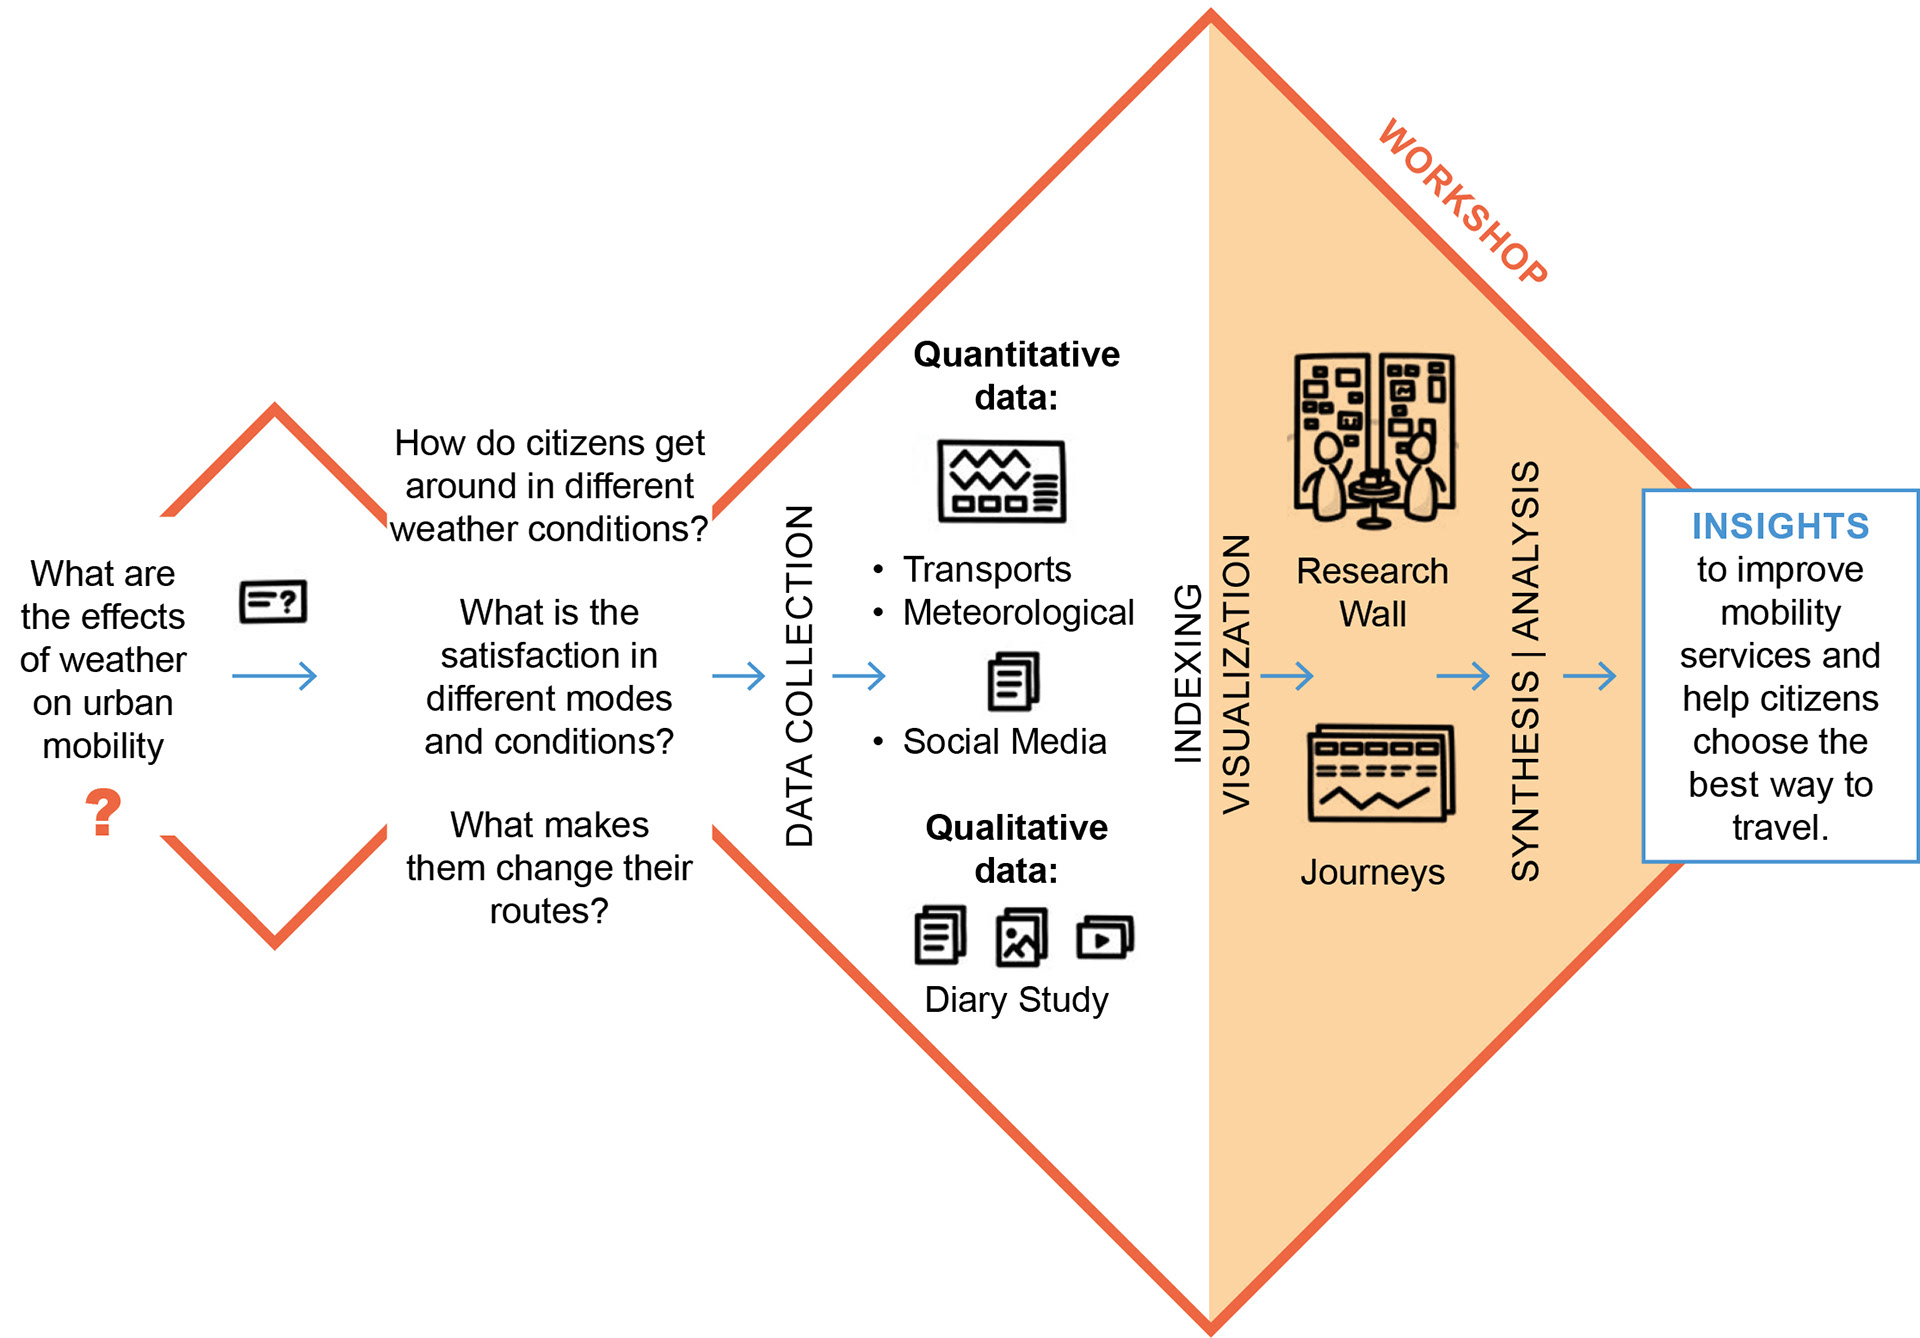
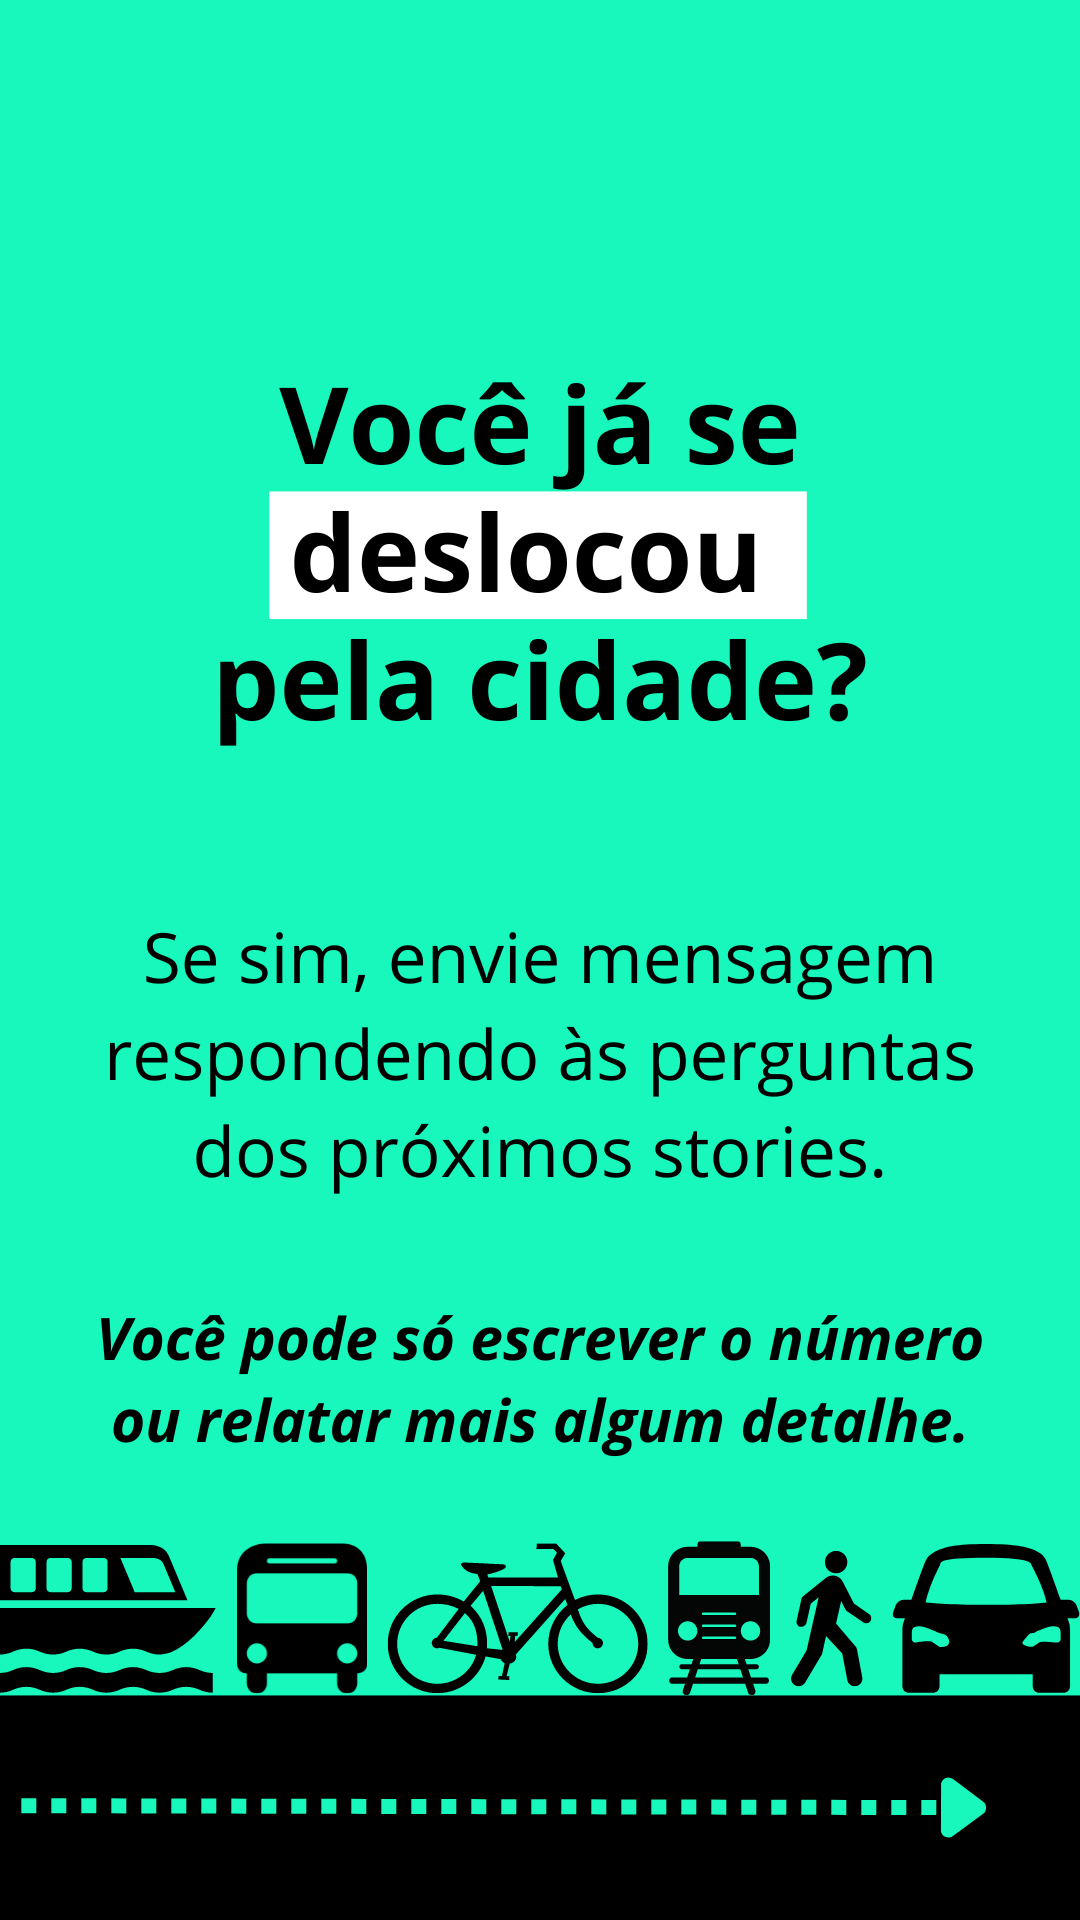
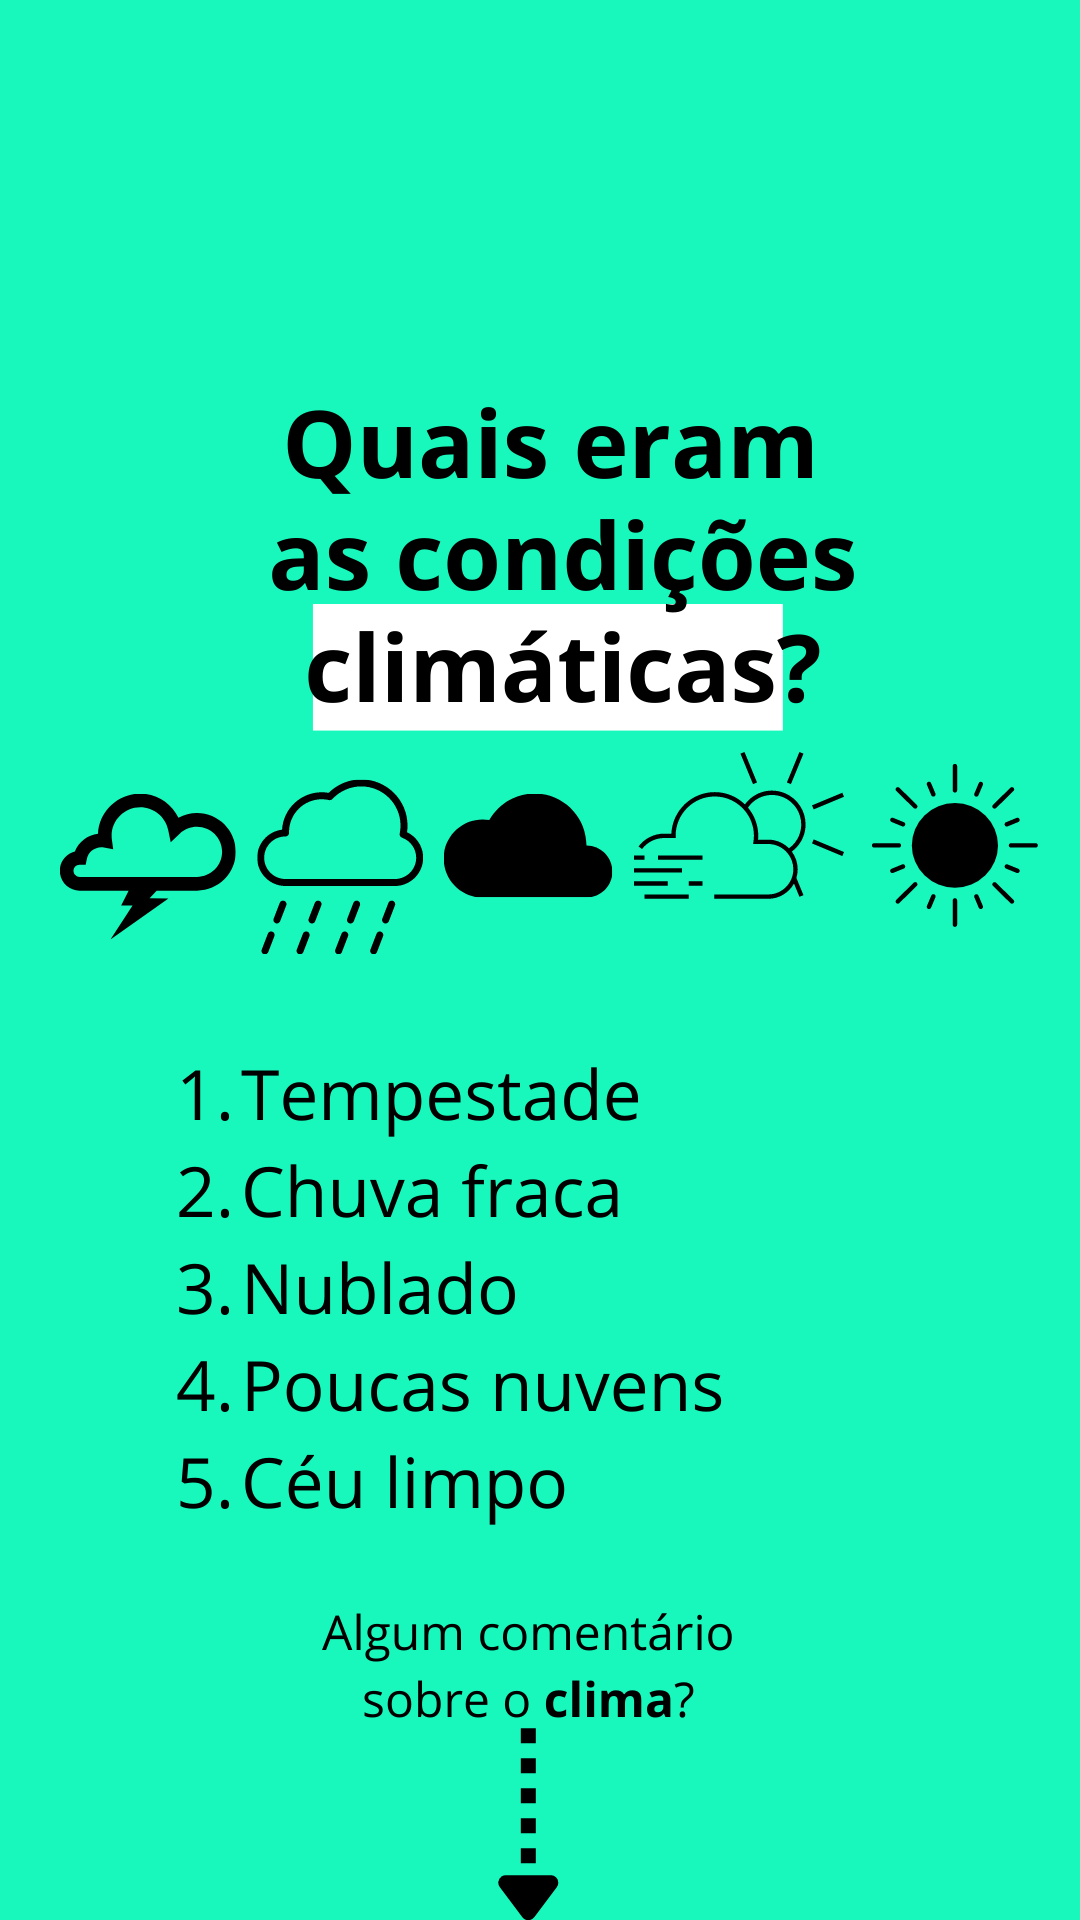
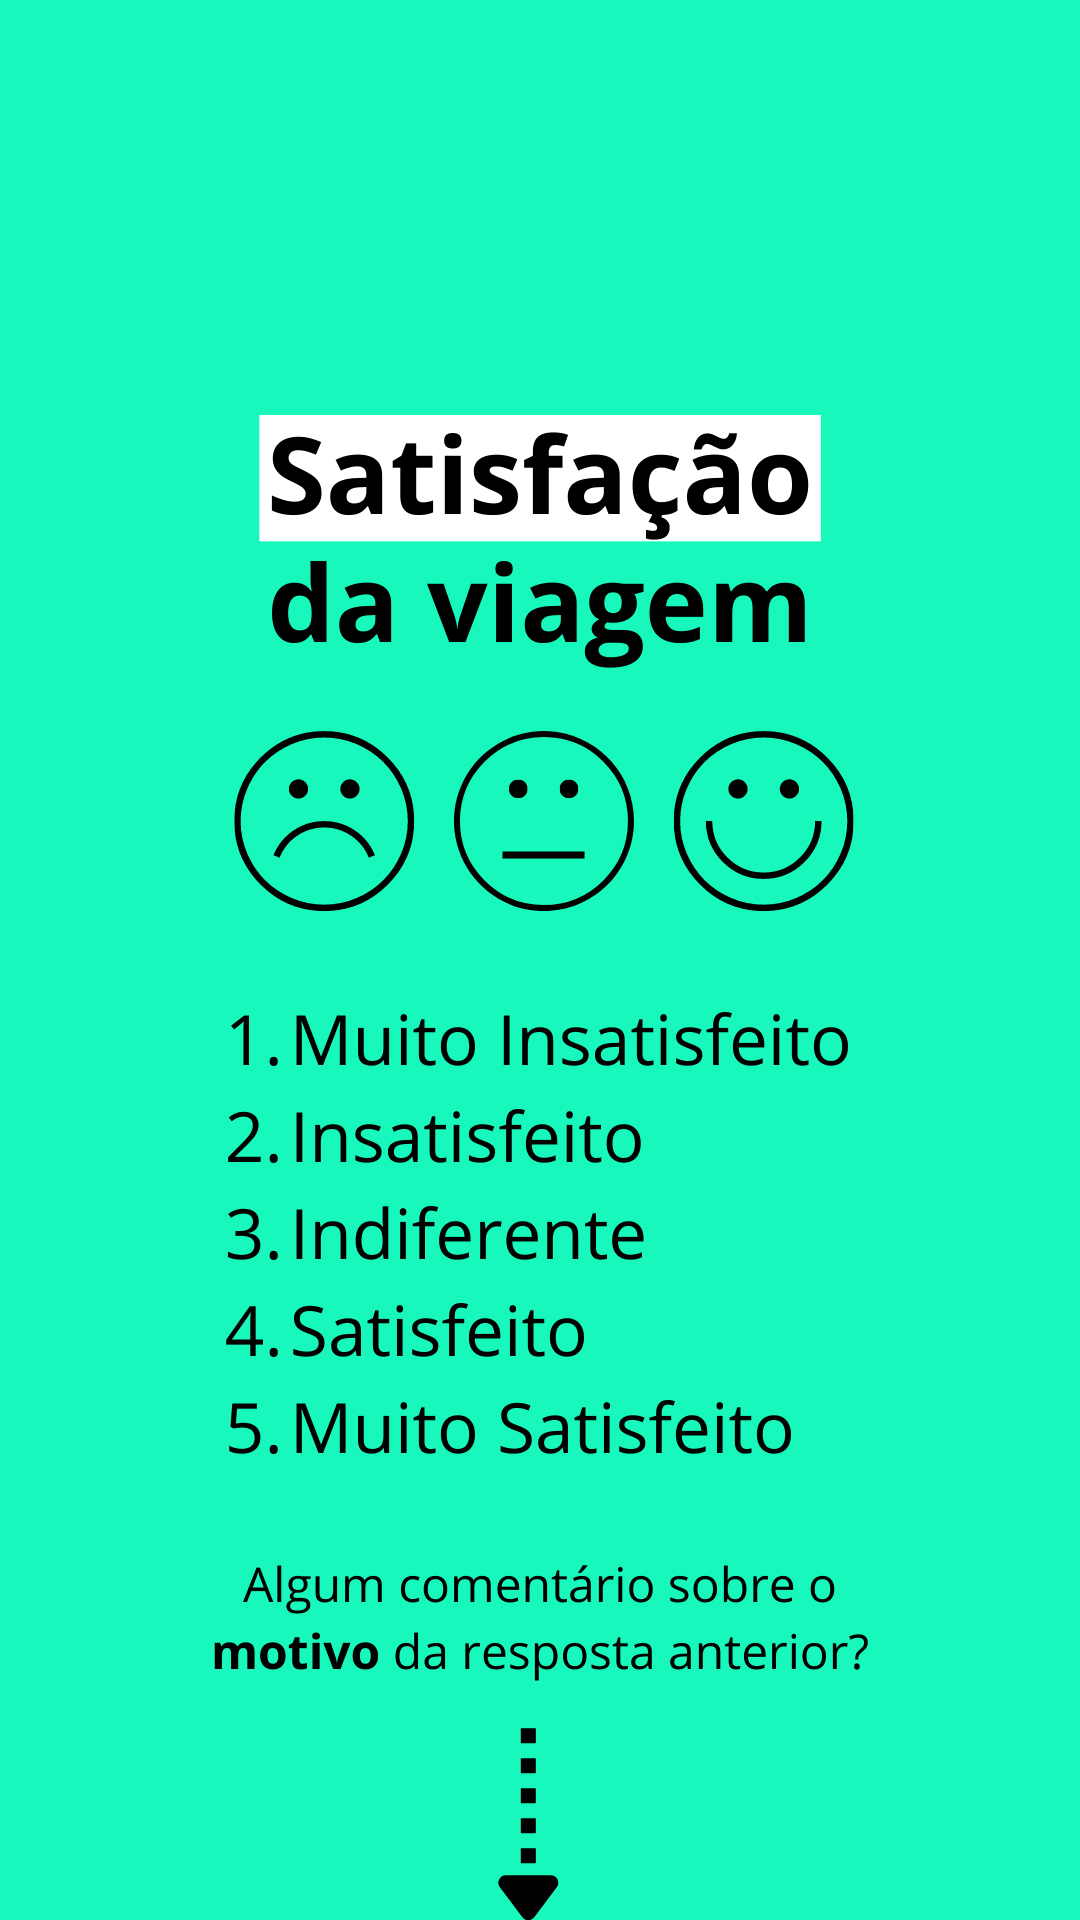
We conducted a user diary study on Instagram, capturing citizens' perspectives on how weather impacts daily mobility choices. (See Interactive Data Visualization)


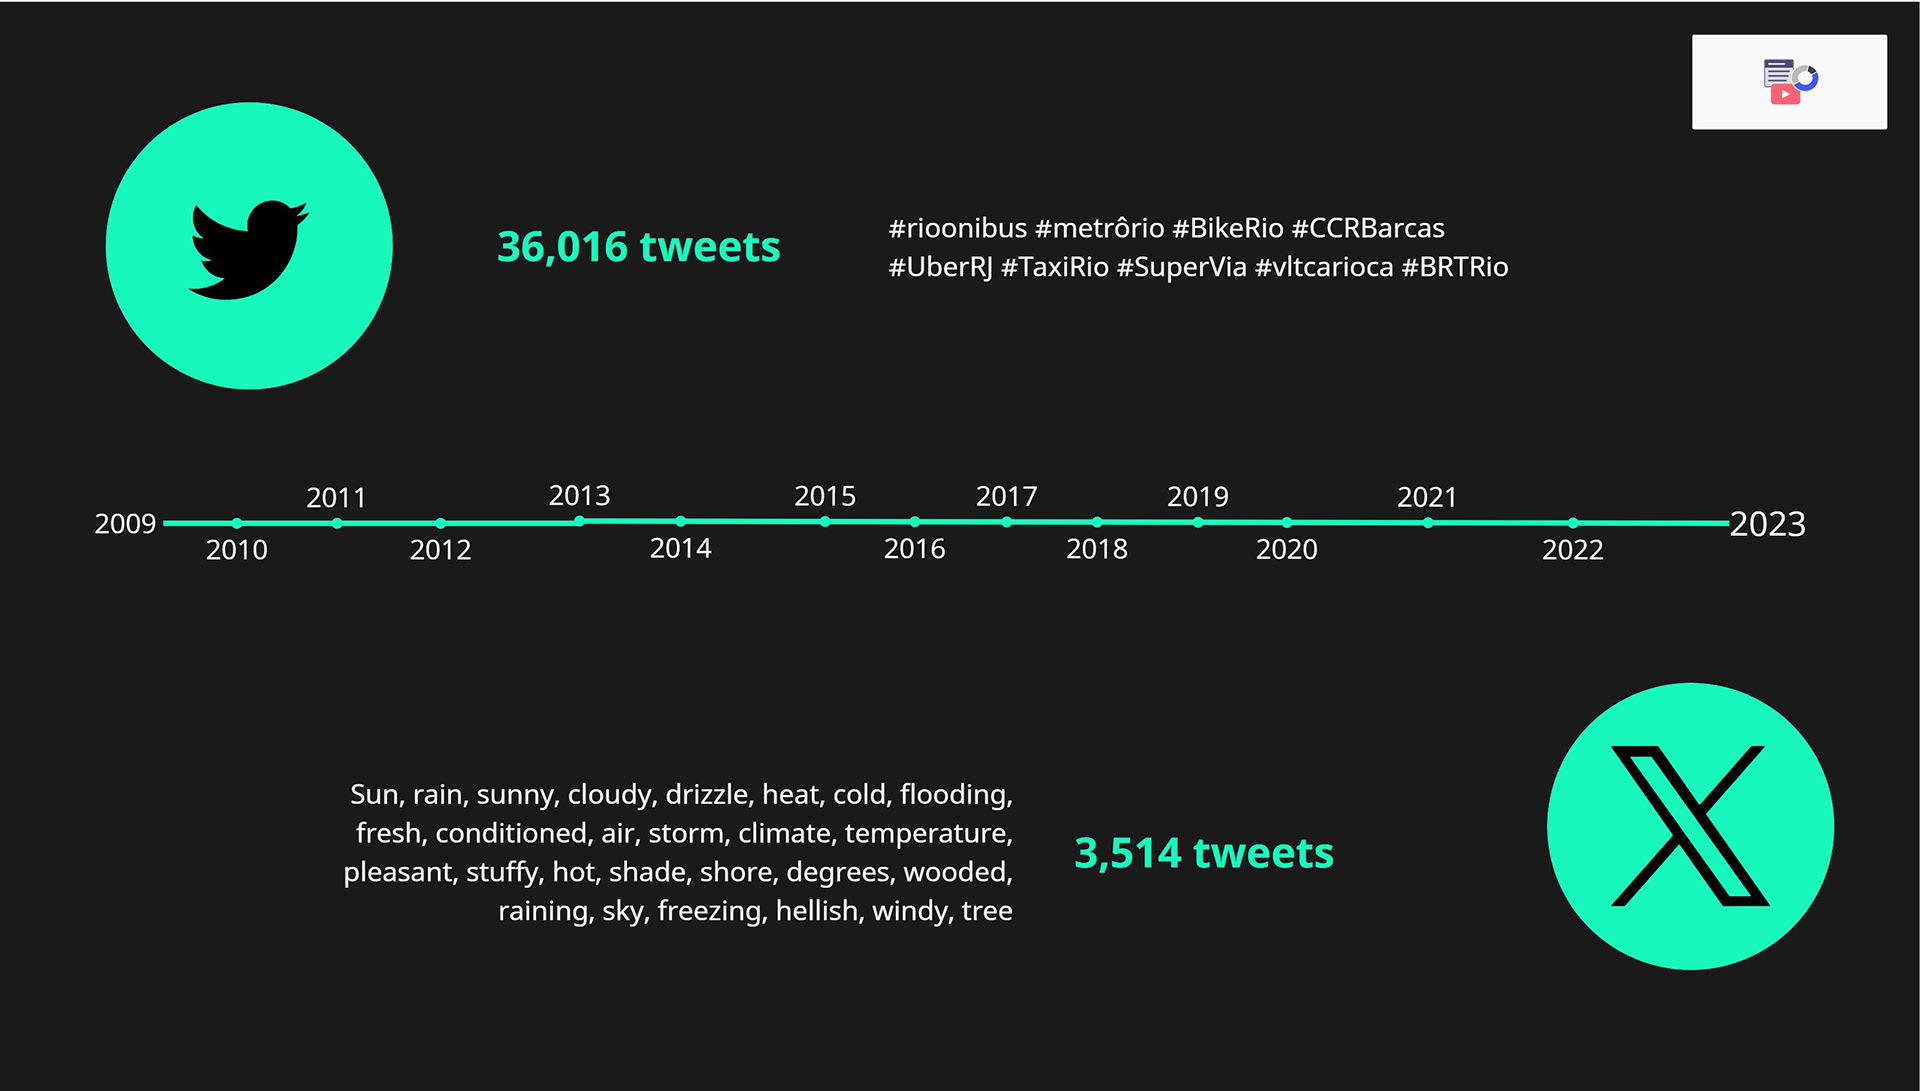
We analyzed 3,514 tweets published in the last 15 years using hashtags linked to Rio's transportation with climate-related words mentioned in the diary. We performed a sentiment analysis of these posts using machine learning and crossed them with the maximum temperature recorded on the day. (See Interactive Data Visualization)
Co-design workshop
Finally, we facilitated a co-design workshop, with participants analyzing the collected data.
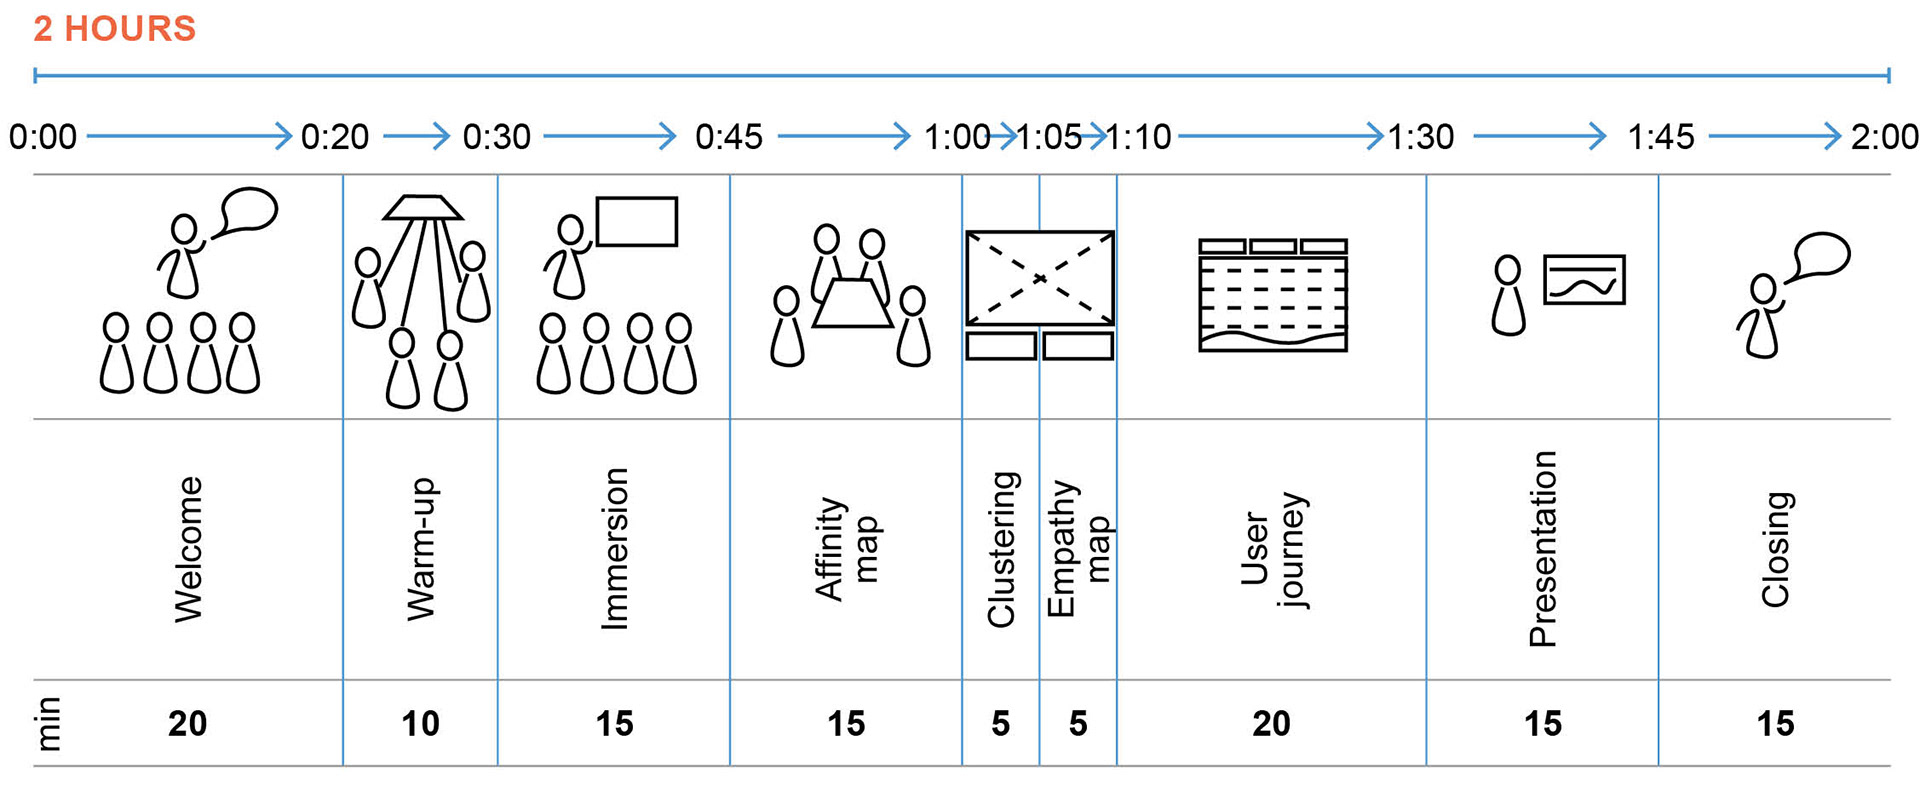
Warm-up
Participants shared their commuting experiences to the workshop venue. We divided the room into four tables, each representing a city region. Participants selected colored strings representing their modes of transport. They raised their arms to share their trip experiences.


Immersion
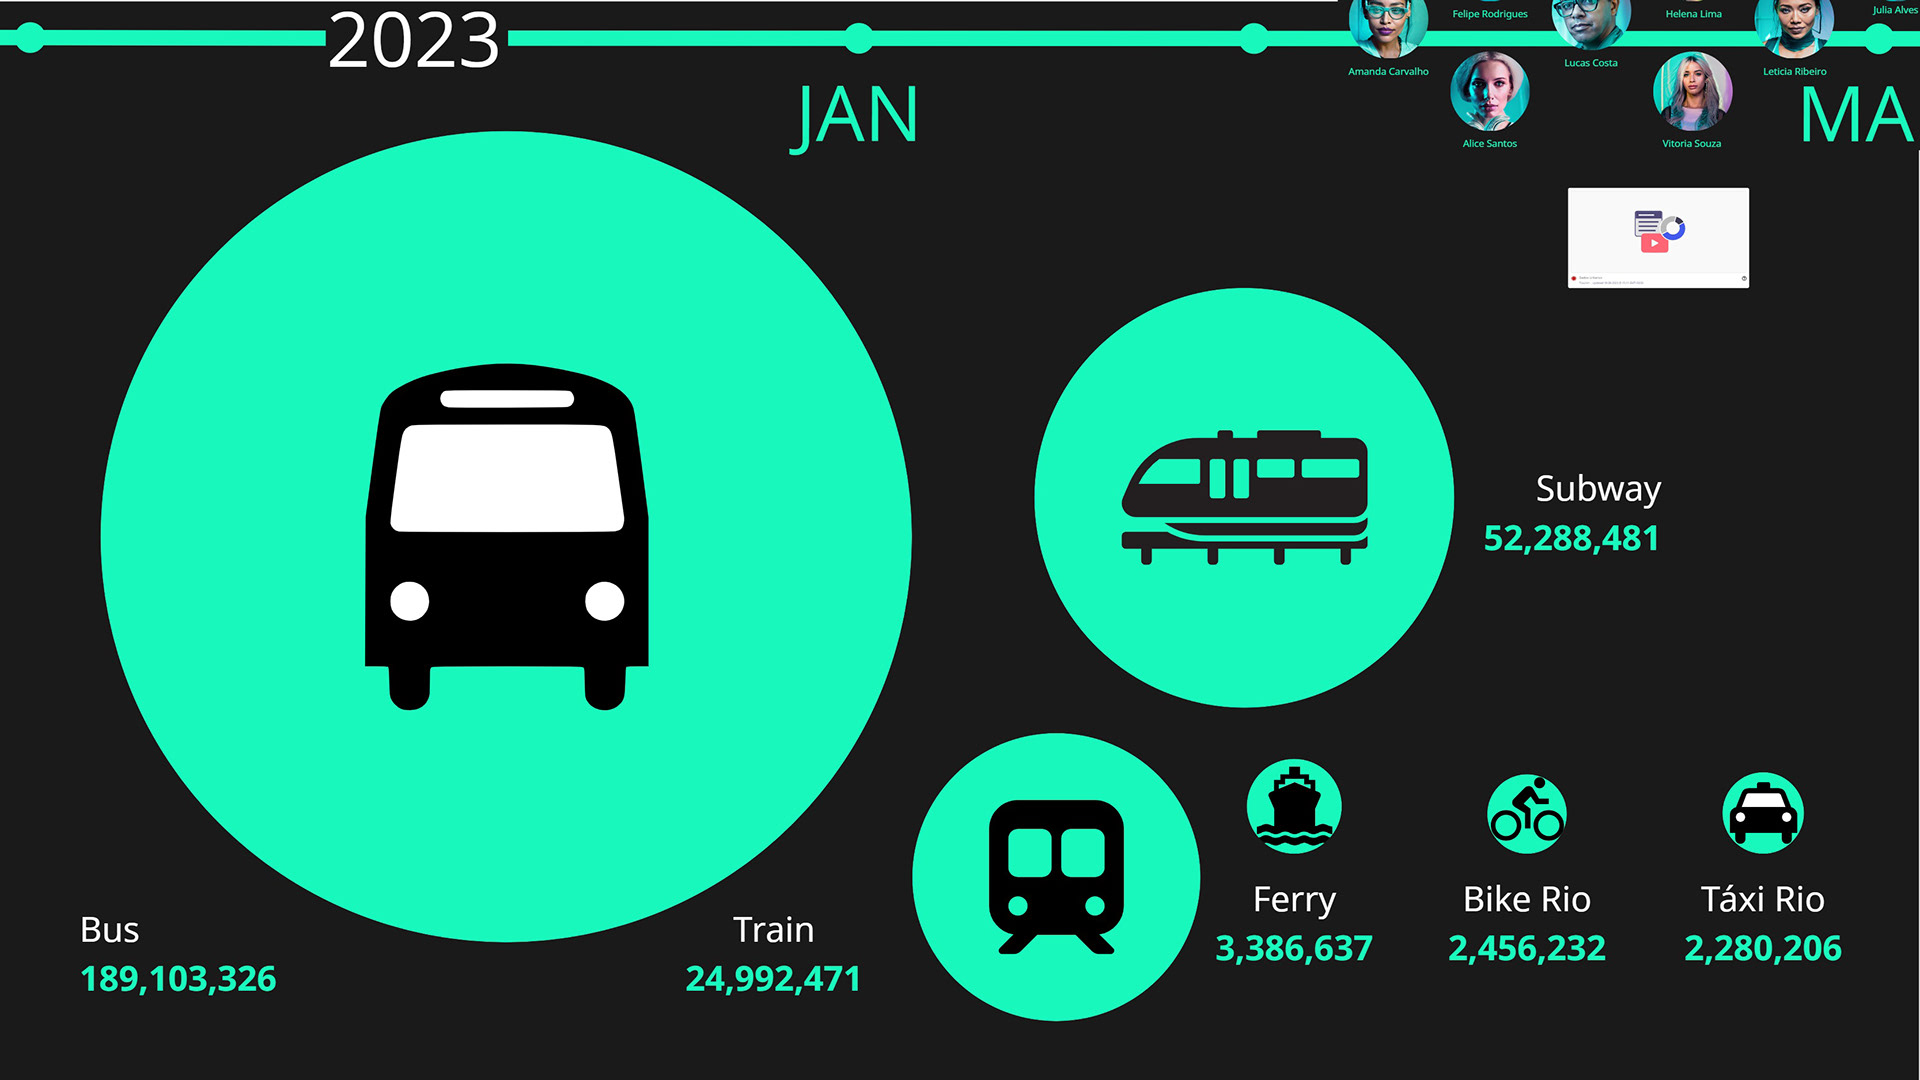
The presentation addressed the potential impact of global warming on urban mobility. The image displayed colored lines representing different years, reflecting the increased temperature of Rio. The timeline begins with a single day and then extends to cover the one-month duration of the diary study. Expanding the timeline to the summer season revealed open data, illustrating the number of trips for each mode of transportation. The timeline further expands to the past 15 years, showing the number of tweets featuring hashtags related to Rio de Janeiro.
Collaborative analysis
Each group had a paper board displaying visualizations, templates for empathy maps and user journeys, a laptop with an interactive visualization tool, cards with diary open comments, and Lego bricks representing trips recorded in the diaries.
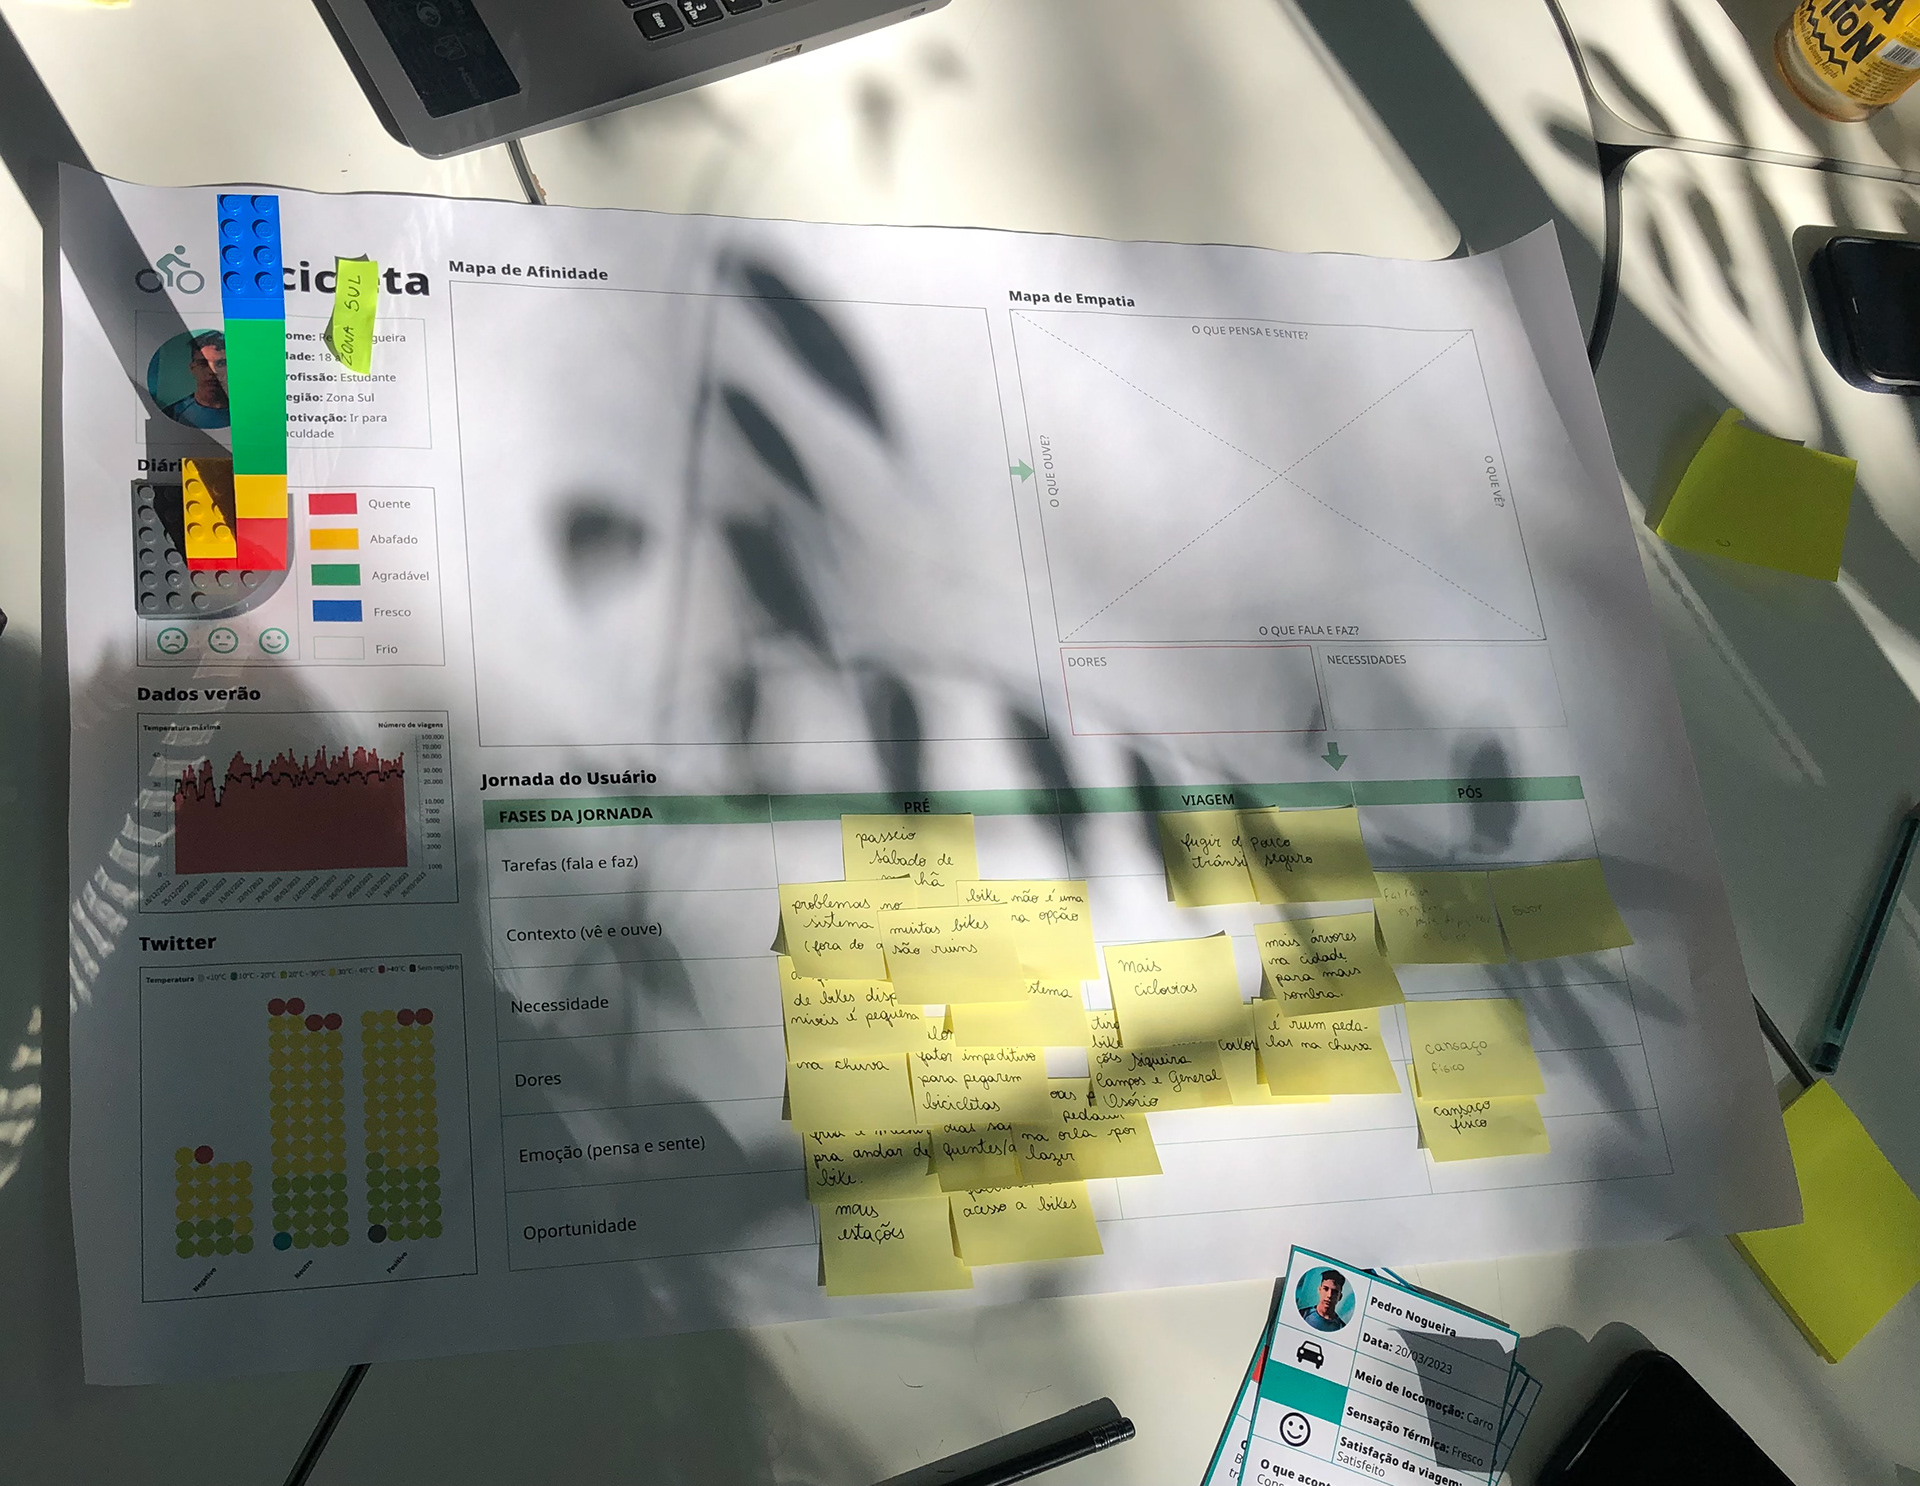
As a result, participants created user journeys for each mode of transportation.

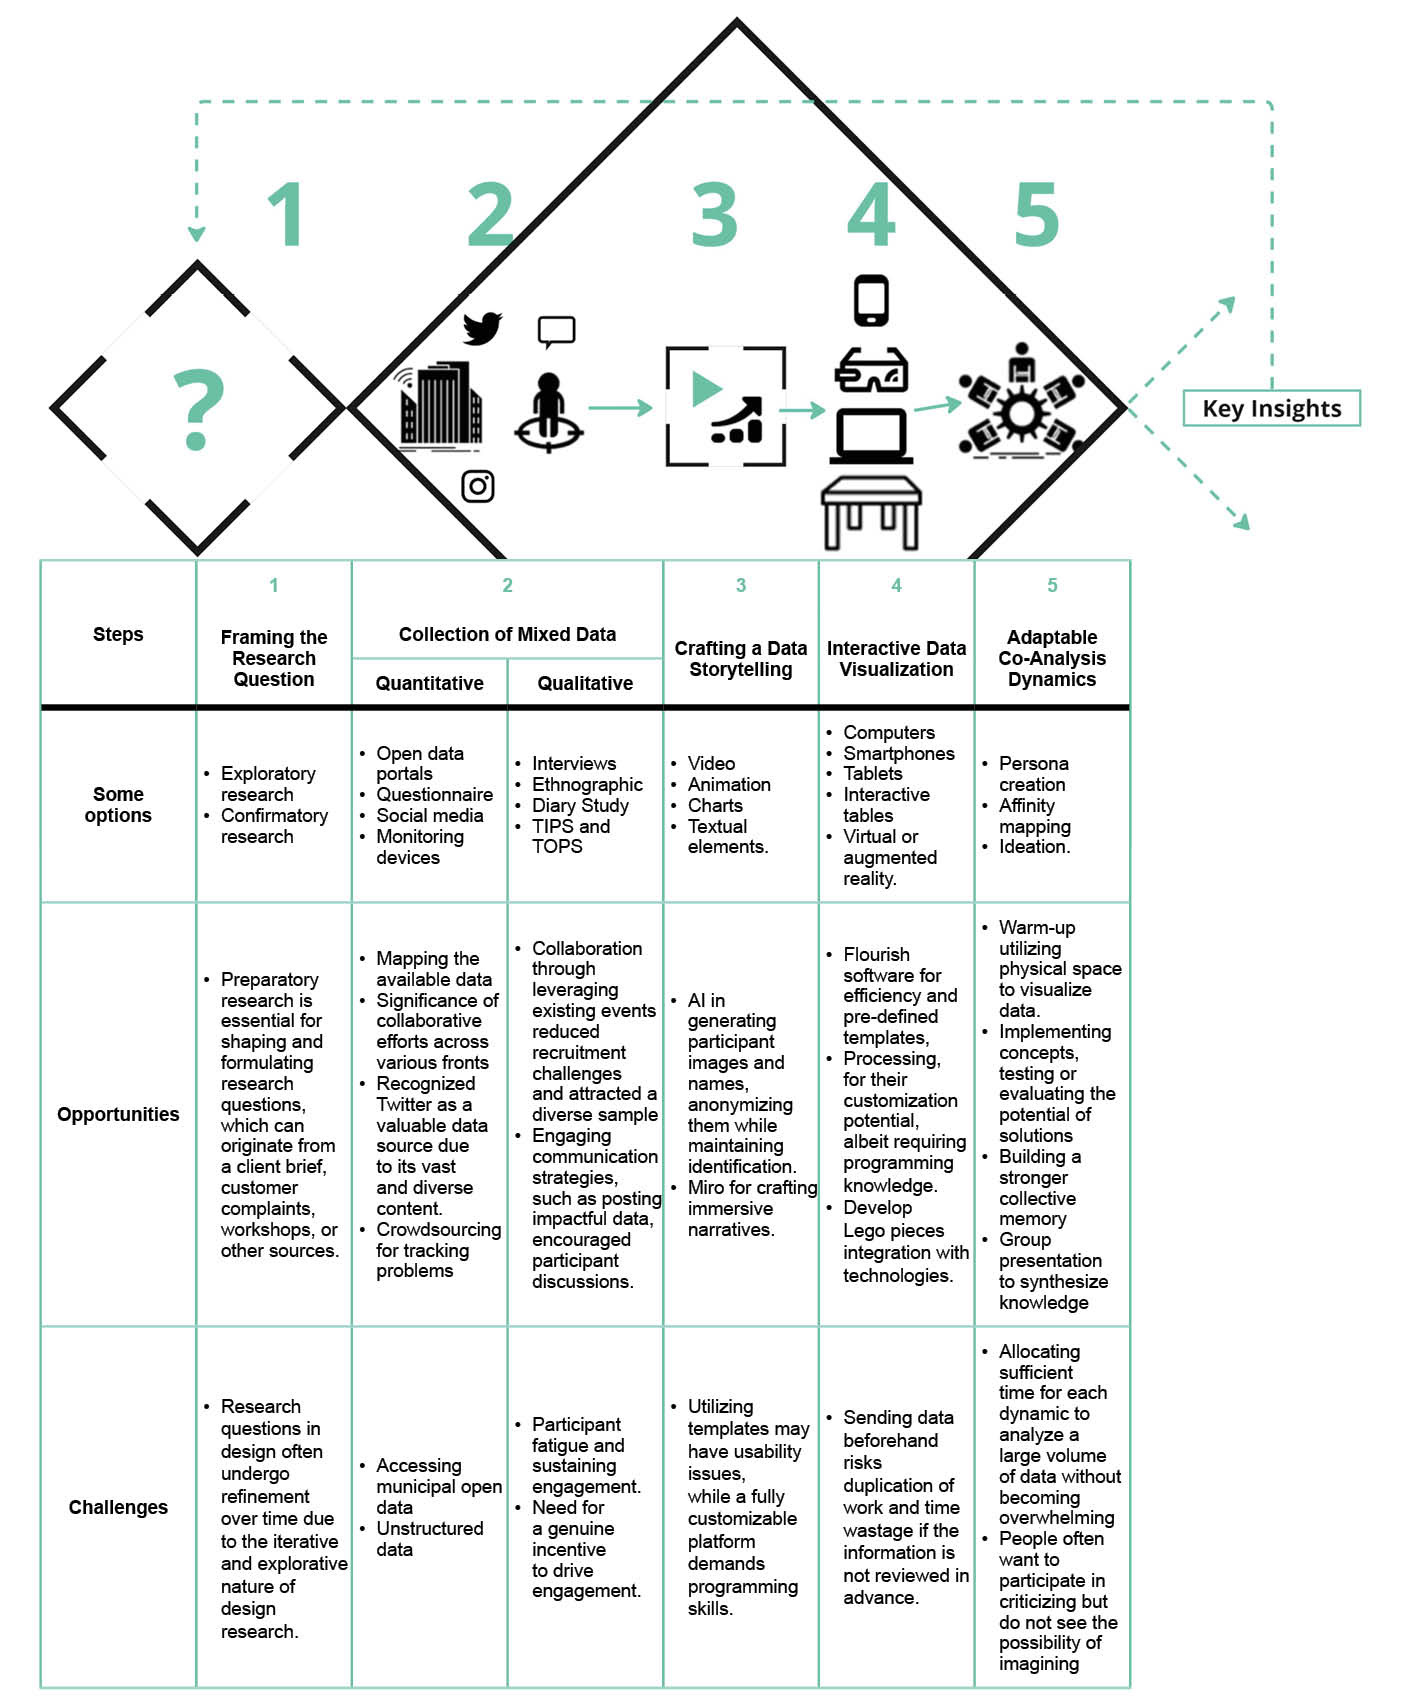
Main result: Proposed Process
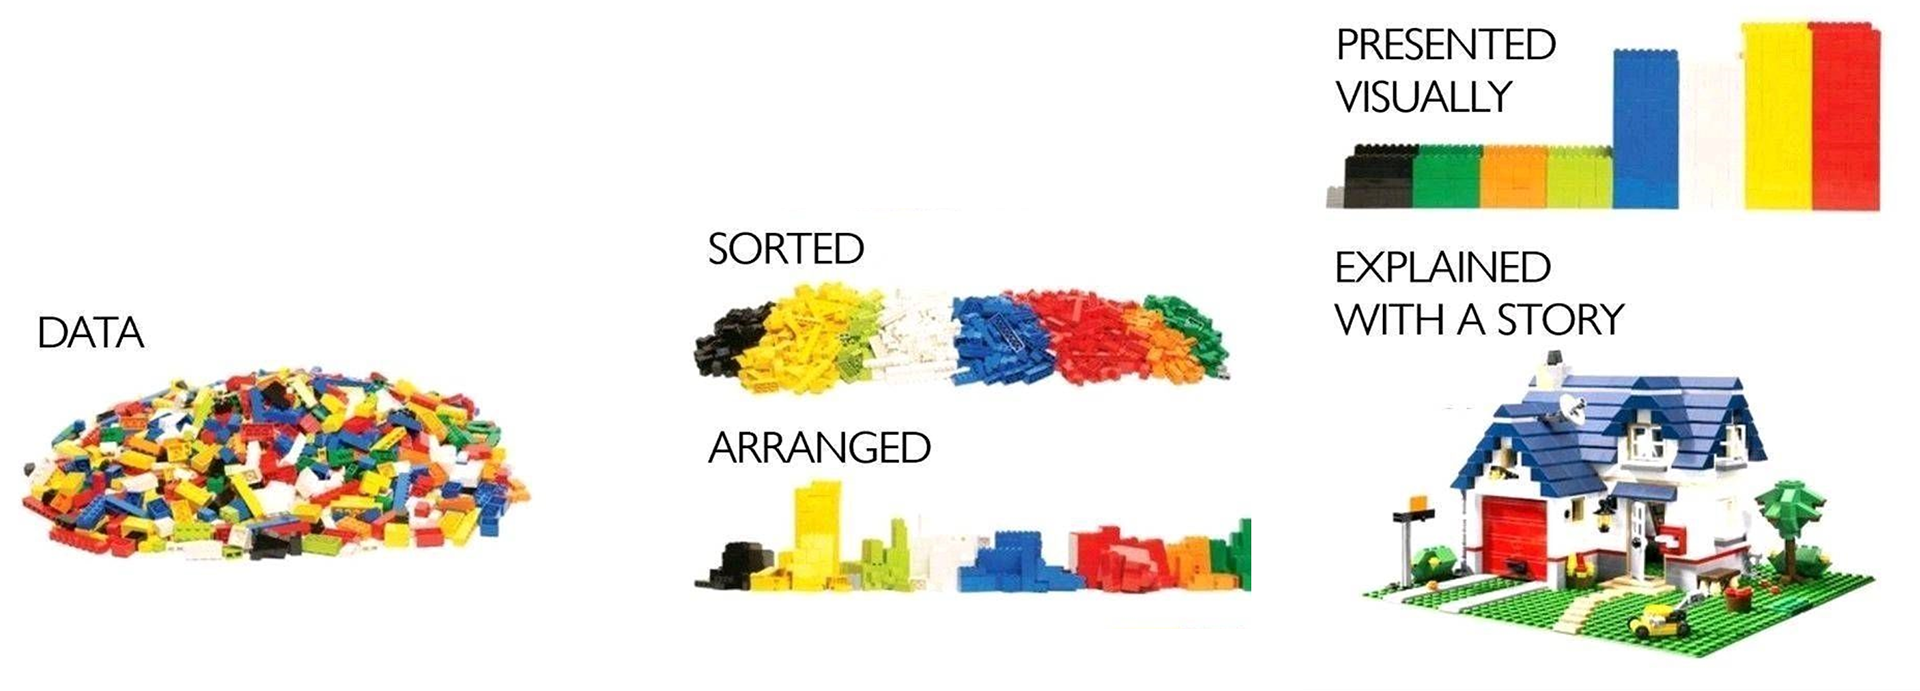
Proposed a co-analysis process for mixed data using data visualization and storytelling.
Tools
Miro, Flourish, Instagram, Twitter api, Python, Tableau, Postman.
Read the thesis
Watch a video demo
Advisor: Manuela Quaresma
Laboratory of Ergodesign and Usability Interfaces - LEUI
PUC-Rio University
Laboratory of Ergodesign and Usability Interfaces - LEUI
PUC-Rio University
Acknowledgements:
Copenhagen Business School
Tembici
Metro Rio
CNPq
Copenhagen Business School
Tembici
Metro Rio
CNPq
Fundação de Amparo à Pesquisa do Estado do Rio de Janeiro (Faperj) for funding the "Doutorado Nota 10" scholarship.
This study was also financed in part by the Coordination for the Improvement of Higher Education Personnel - Brazil (Capes) - Finance Code 001.